A website can open while its main offer appears late. The menu may look ready, but the first tap produces no timely response. A purchase button may shift just as someone tries to select it. These are visible obstacles for visitors and business risks when an important action becomes delayed, confusing, or interrupted.
Core Web Vitals are three metrics for real visitor experience: when the main content appears, how quickly the page responds, and whether the layout stays stable. They are not a complete score for website quality, and they do not measure sales, inquiries, or satisfaction by themselves. Their value is that they turn visible problems into data that can be prioritized and checked after a correction.
The useful question is not "How do we get a score of 100?" It is "Which real visitors face an obstacle, on which important pages, and what should we fix first?"
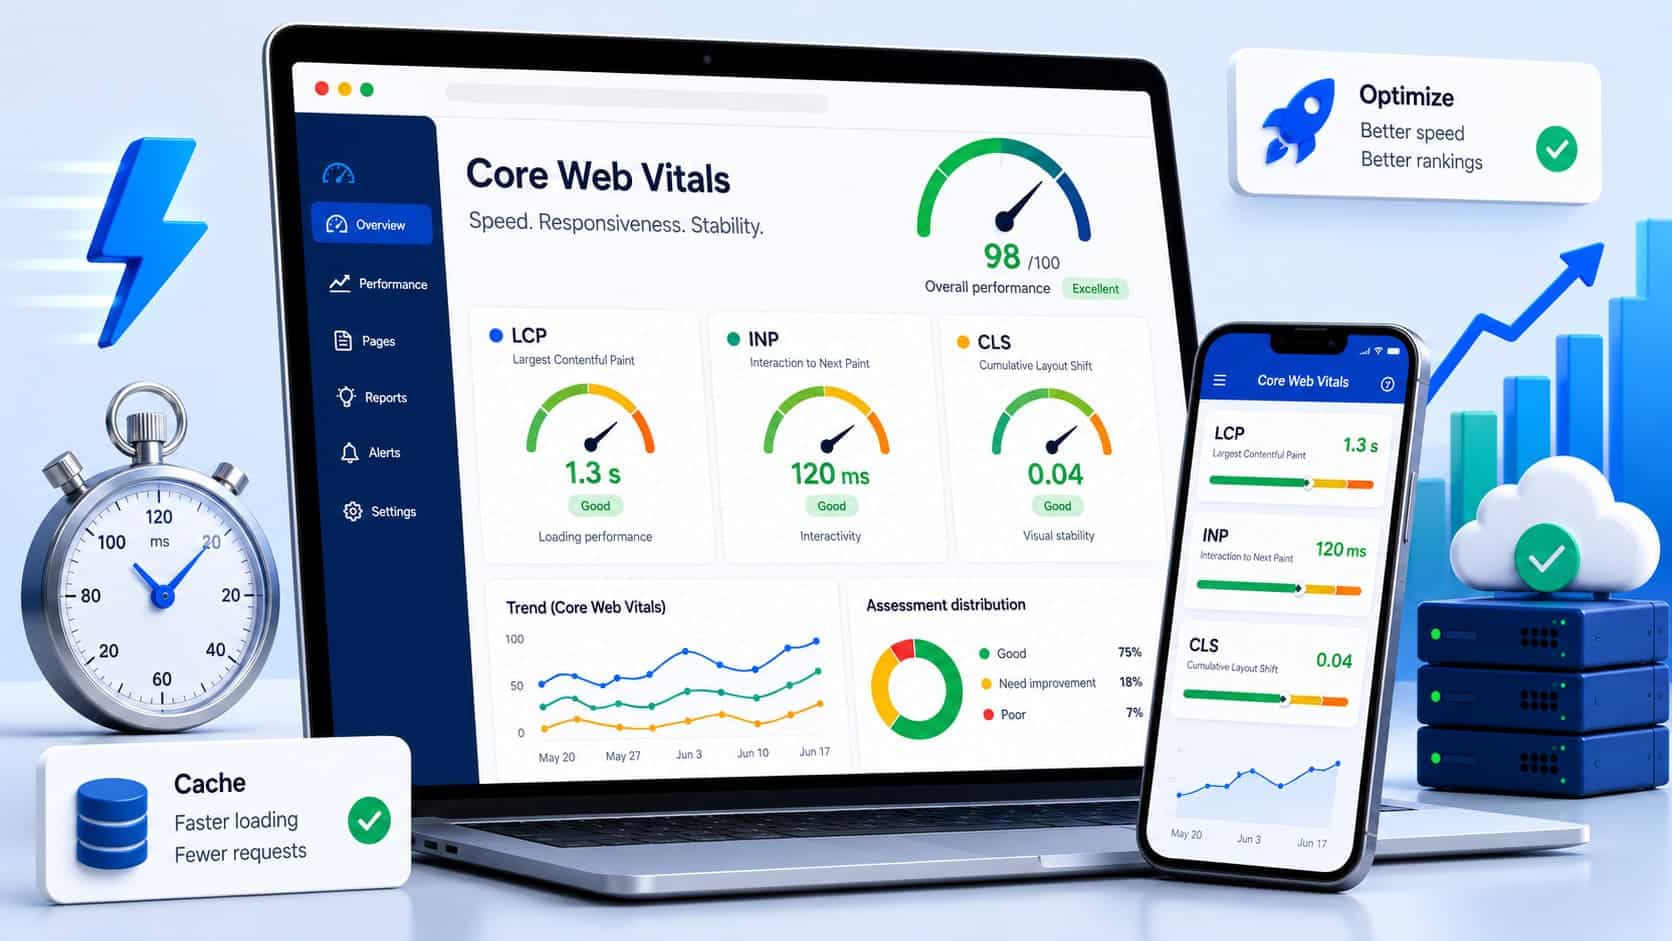
Google defines Core Web Vitals as metrics for loading performance, interaction responsiveness, and visual stability. The current set includes LCP, INP, and CLS. According to Google's official Core Web Vitals documentation, the target values are:
| Metric | What It Measures | Visible Symptom | Good Value |
|---|---|---|---|
| LCP | When the main visible content appears | A large image, heading, or offer appears late | Up to 2.5 seconds |
| INP | How quickly the page shows a response after an action | A button, menu, filter, or form responds late | Up to 200 milliseconds |
| CLS | How much the layout shifts without a visitor action | Text, a button, or a field suddenly moves | Up to 0.1 |
The assessment uses the 75th percentile of visits. In practical terms, at least 75% of measured visits must meet the relevant threshold for a good result. Mobile and desktop data are assessed separately.
The three metrics describe different problems. A good LCP does not compensate for a button that responds slowly. A good INP does not prevent a shift that causes the wrong item to be selected. Understanding the weak metric and the visible symptom is more useful than chasing one overall green score.
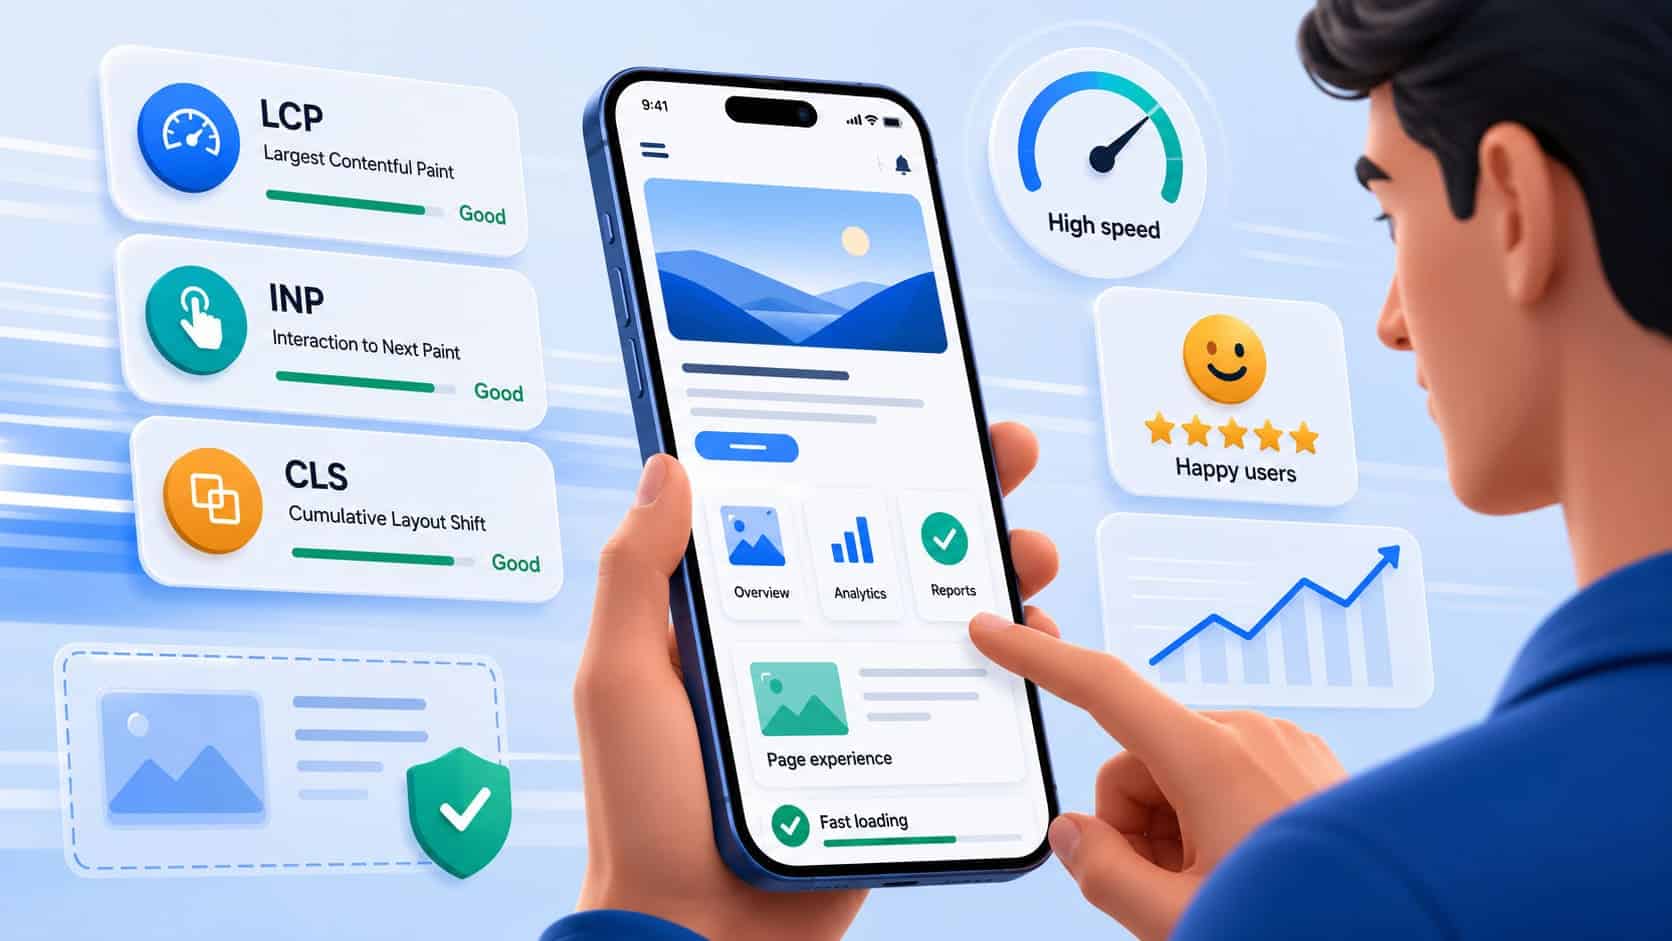
Largest Contentful Paint measures the time until the largest visible text or image element appears in the initial viewport. On a service page, this is often the main heading, a large image, or the leading offer. On an ecommerce category, it may be the title, banner, or first large product area.
Poor LCP often feels like blank space, a late image, or a delayed main offer. The page may have started loading, but the visitor still cannot see the information that brought them there.
Image size alone does not identify the cause. The web.dev guide to optimizing LCP separates server response time, the delay before the main resource is requested, its download time, and the delay before it is displayed. This prevents blind file compression when another part of the sequence is the real problem.
Common areas to check include:
Priority is high when the problem affects the first screen of important service, category, or product pages. The correction should start with the specific LCP element and its loading sequence, not a random list of general recommendations.
Interaction to Next Paint measures the page's response to clicks, taps, and keyboard input throughout a visit. It records the time from an action until the next visible update on the screen. INP replaced FID as the Core Web Vital for responsiveness.
The symptoms are easy to recognize:
Poor INP does not automatically mean that the whole website loads slowly. A page may appear quickly and then respond poorly. Common causes include long tasks on the browser's main thread, too much work after one action, heavy third-party scripts, or a complex layout that is expensive to recalculate.
The official guide to improving INP recommends starting with real-user data and then reproducing the slow interaction in a laboratory test. For a business decision, that means naming the exact difficult action before planning the technical correction.
Cumulative Layout Shift measures unexpected movement of visible content. The value has no unit. A higher value means a less stable layout.
The typical symptom is a button, line of text, or product card moving without the visitor requesting it. Someone may select the wrong item, lose their reading position, or have to wait for the page to settle.
Google lists images and embeds without reserved space, dynamically inserted content, and web fonts among the common causes. The web.dev guide to optimizing CLS explains the details.
Practical checks include:
CLS has a direct visual meaning. Do not look only at the number. Record which element moves, when it happens, and which action may be disrupted.
One PageSpeed Insights test is not enough for a final decision. The tools show two types of data with different purposes.
| Data Type | What It Shows | What It Is For |
|---|---|---|
| Real-user data | How measured visitors experienced the page across devices and connections | Confirming real scope and monitoring after a change |
| Laboratory test | How the page behaves under predefined conditions | Reproducing, diagnosing, and checking during development |
PageSpeed Insights combines CrUX field data with a Lighthouse laboratory test. The Core Web Vitals report in Search Console uses real-user data and groups similar URLs. Search Console Help explains that the report covers a 28-day period and groups pages rather than serving as an instant lookup for one URL.
Start with real-user data when it is available because it answers whether the problem occurs in actual visits. Then use laboratory tools to understand the cause and check the change before release.
If a specific page has insufficient CrUX data, that proves neither a good nor a poor result. You may use origin-level data, a laboratory test, and your own real-user measurement, but each conclusion should be labeled according to its evidence.
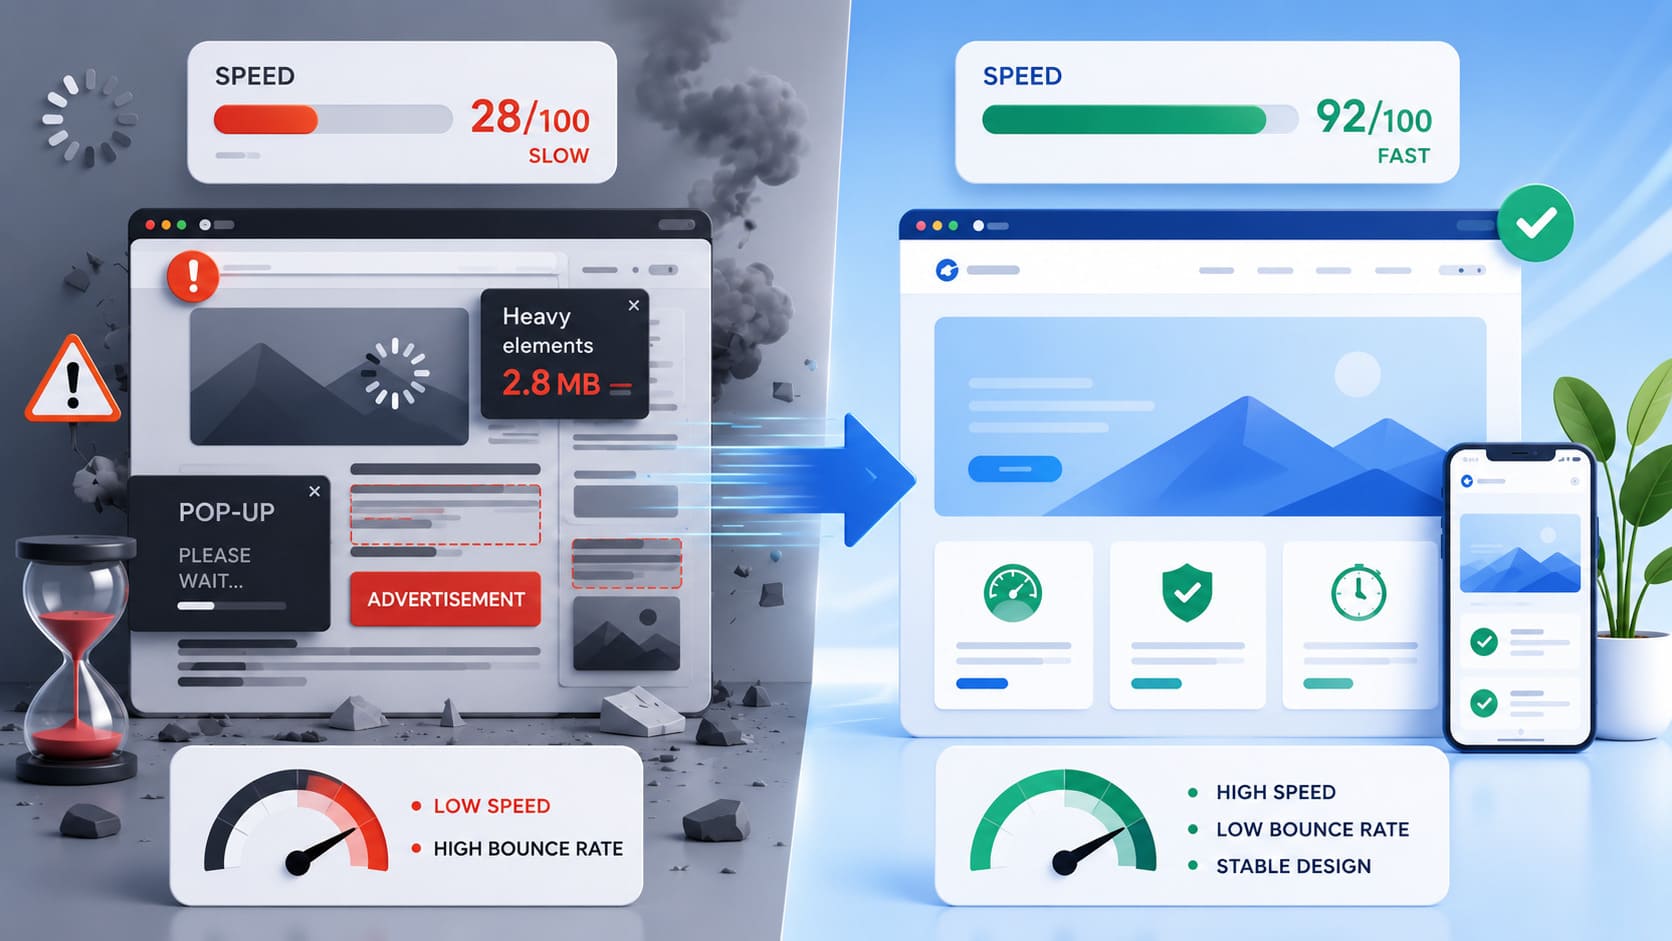
Page speed decisions increasingly depend on combining field evidence with reproducible laboratory diagnosis. A difference between two PageSpeed Insights checks does not necessarily mean the tool is broken. It may result from:
Another important trend is moving away from a plugin-first response. The useful sequence is to identify the affected visitor action, confirm the weak metric, locate the responsible component, and then choose the smallest correction that addresses that cause.
Do not manage the project from one screenshot of a score. Record the exact page, device type, data type, change date, and metric that should improve.
Not every yellow or red value deserves the same budget or urgency. Prioritize work where a measured problem, a visible symptom, and an important page overlap.
| Priority | When It Is Justified | Next Action |
|---|---|---|
| Critical | Field data shows a poor result on a key template and there is a visible obstacle to an important action | Isolate the cause and correct the affected template |
| High | The problem affects a group of service, category, product, or form pages | Test representative URLs and the shared component |
| Medium | A laboratory test finds a repeatable problem, but field data has not confirmed it | Correct it in a controlled environment and monitor after release |
| Low | Field metrics are good, no visible symptom exists, and the goal is only a higher laboratory score | Check whether another task would create more value |
This matrix does not replace analysis of the specific website. It prevents two common mistakes: ignoring a real problem on an important page and spending time on a perfect score without a clear benefit.
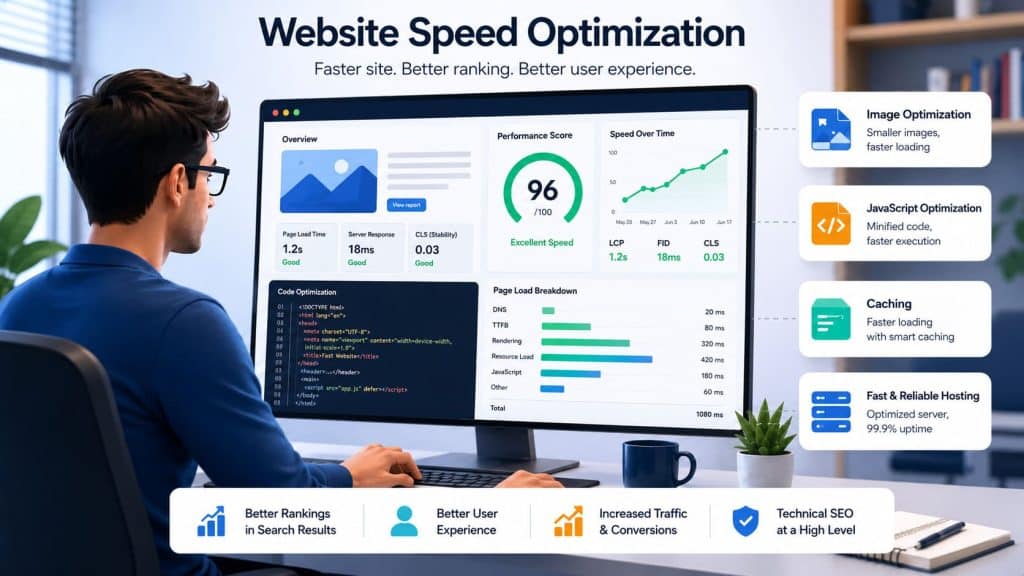
For LCP, identify which main content appears late and why the browser cannot show it sooner. For INP, name the slow action and trace the work blocking the next visible response. For CLS, identify the moving element and reserve its space in advance.
Installing several speed plugins without a measured cause can add code, create conflicts, or hide the problem temporarily. The same applies to disabling features, compressing every image to unacceptable quality, or aggressively delaying scripts required by an important part of the page.
Core Web Vitals do not show how many sales or inquiries were lost. They show technical experience. The business effect must be checked with the website's own data without assuming causation in advance.
A suitable review compares:
If a poor metric and a difficult action occur in the same place, that justifies a priority investigation, but it does not automatically prove the size of the financial effect. After the correction, monitor both the metric and the business action. Do not attribute every outcome change to speed alone.
Core Web Vitals are used by Google's systems as part of the wider assessment of page experience. They are not one universal signal that decides rankings by itself.
Google states explicitly that good Core Web Vitals do not guarantee top rankings and that pursuing a perfect score only for SEO may not be the best use of time. Helpful, relevant content remains fundamental. When pages provide similarly helpful content, a better experience may contribute to success.
The practical conclusion is simple: do not treat speed and content as competing priorities. A page must answer the visitor's question while avoiding technical obstacles to access and action.
One oversized image or missing dimensions can often be corrected during routine maintenance. Broader diagnosis is appropriate when:
In that situation, a technical SEO audit should connect the affected pages, field data, reproducible symptoms, and specific technical causes in an ordered action plan. The goal is not a list of every possible recommendation. It is a clear sequence: what obstructs visitors, which pages matter most, and which correction should be tested first.